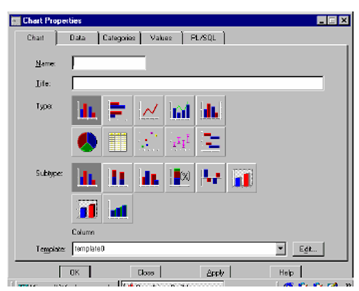
Chart Properties:

Chart properties describe options for the chart as a overall, involving its related chart template and query. A Chart property is accessible by the Chart property sheet that is a multi tab page object. The tab pages are organized as given below:
Chart: Involves the chart's Name, Title, Template and Chart Type.
Data: Involves query associated properties like as a Query Filter Function and the range of data to plot.
Categories: Involves the chart Category and any sub-categories to plot in the chart. A Category data is plotted at fixed intervals. It is not considered to be mathematically associated and is commonly plotted along what is called the discrete axis like X axis.
Values: Involves the chart values. It dependent data commonly begins at one value and continues until another value. It is considered to be mathematically associated and is commonly plotted along what is called the Continuous axis like Y axis
PL/SQL: Involves any mouse events and related procedures for the chart.
