Turning Moment Diagram of a Single Cylinder:
4-stroke IC Engine
If the influence of correction couple is ignored, the approximate turning moment
M = (Gas force + Inertia force) O2 D
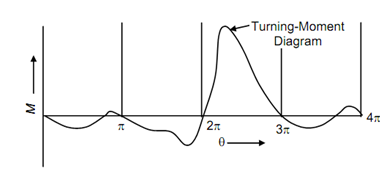
The diagram that is plotted for 'M' against crank angle 'θ' is known as turning moment diagram. This diagram may be plotted progressively as described below:
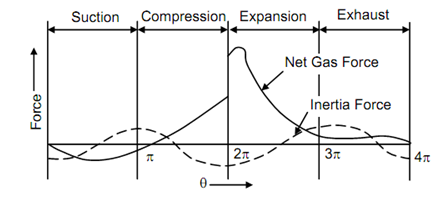
(a) There are two forces that mean gas force and inertia force.
Gas force = p × Piston area where p is the gas pressure.
here p is the gas pressure.

(a)
The variation is the gas force shall be because of the change in pressure. The gas force and inertia force have been plotted in given Figure (a) for all the four strokes.
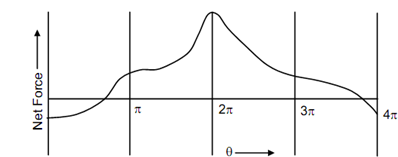
(b) The net force is the resultant of inertia force and gas force. It may be plotted in reference to θ as illustrated in Figure (b).

(b)
(c) The value of O2D is given by
O2 D = r (sin θ + cos θ tan φ)

For several values of θ, O2D can be estimated and then plotted. The plot of this is illustrated in Figure (c).

(c)
(d) The approximate turning moment 'M' = Net force × O2D. The plot of 'M' Vs θ is illustrated in given Figure (d).

(d)
The turning moment in exhaust stroke and the suction stroke is very small. In case of expansion stroke and compression stroke turning moment is higher. In case of compression stroke energy is to be supplied and in expansion stroke large amount of energy is available. Surveying the turning moment diagram, this is observed that the energy is supplied in three strokes and energy is available just in one stroke. In three strokes, that means compression, suction stroke, and exhaust stroke the engine is starving and it is expansion stroke this is harvesting. At the similar time it is observed that there is big variation of turning moment throughout the cycle. The variation in the turning moment results in corresponding variation in speed.