PEXE Method
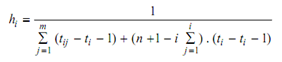
The distribution function called Piecewise Exponential Estimator was proposed by Kitchin (1980). In a data of size n, if t1, t2, . . . , ti are observed failure times and ti1, ti2, . . . , tim are suspended data between two successive failure times, then the failure rate estimation is given by,
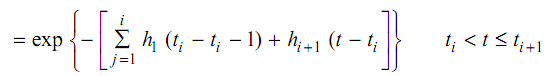
The survival function is given by,
R (t) = exp (- h1t) 0 ≤ t ≤ t1
In this method, constant failure rate is fitted to each interval. The exponential survival functions are pieced together to form piecewise exponential estimator. This is a continuous function. In order to construct the TTT plot from PEXE an estimate of survival function after time tn must be made. If there are suspensions after last failure, then final TTT can be obtained using Equation. If there is evidence that failure distribution is increasing failure rate (IFR) class, then Weibull distribution can be assumed and the final term of TTTn + 1 can be evaluated using the expression.
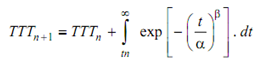
Where α (scale) and β (shape) are parameters of Weibull distribution. The method of evaluation of second term in equation is described in next section. [The PEXE can be seen as a generalization of the Nelson estimator in its original form, i.e. without any suspensions, the PEXE is equal to the Nelson estimator].
Precisely, Survival function is
and Si is
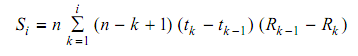
The scaled TTT, φi is equal to Si / Sn +1, where Sn + 1 is given by
Sn +1 = Sn + (α / β). (tn/α) . Exp [- (tn / α)β]
And α and β are ML estimates of Weibull distribution.