Methods of Trend Analysis
Trend analysis is carried out in basic ways viz. graphical and analytical. These methods are described below.
1. Graphical Methods for Trend Testing
The following two methods are most popularly employed graphical methods for monitoring monotonic trend.
This is most powerful test and gives easy understanding because of its pictorial nature. To perform this test, first of all, the Time Between Failures (TBFs) of the equipment is collected in chronological order. The Cumulative Time Between Failures (CTBF) are then calculated and plotted against the cumulative number of failures. By the presence of trend in TBFs, we mean that whether the equipment or the item is deteriorating or improving with age.
By simply plotting cumulative TBFs against the cumulative number of failure we can test whether the machine or item under consideration is improving or deteriorating. If we get a curve concave upward (note the opposite characteristic in TTT plot), this means that the TBFs are becoming shorter and shorter, that is to say, the machine is deteriorating. On the other hand if we obtain a curve concave downwards, this means that the machine is improving.
The data which exhibits linearity can be considered to have no trend. Such trend plot is known to exhibit independently and identically distributed (i.i.d.) data in statistics and has to be further analyzed by statistical distributions.
This is a simple analysis of testing presence of trend. In this we pass our eye through chronological TBFs and search for increase or decrease of the failure rate i.e. if the TBFs are showing increasing failure magnitude towards the end, it shows decreasing failure rate. If the magnitude of TBFs decreases towards end, then it indicates increasing failure rate. If the magnitude of TBFs is approximately constant throughout the period then it shows constant rate of failure.
A slight modification can be done to this test. First tabulate the cumulative frequency and divide the total period into equal number of parts usually from 5-10. (The class interval can be judged by using Sturge's formula) then find the number of failures in each period of operations. If there is increasing number of failures for each period, then it indicates increasing failure rate and so on. Further, this can be easily judged by fitting a linear trend line.
2. Analytical Trend Tests
This test is highly useful for distinguishing between an HPP and a monotonic trend. Its high degree of accuracy keeps in top position of all trend tests. However, it is tedious and cumbersome to calculate, particularly when the data is large. Further, it requires the calculation from the beginning at every time while the graphical tests can provide instant answers at any point of the data.
We will discuss the specific situation where one system is run until a pre-specified number of failures, m has occurred. Under HPP assumption the first m - 1 arrival times, T1, T2, . . . , Tm - 1 are the order statistics from a uniform distribution on (0, tm).
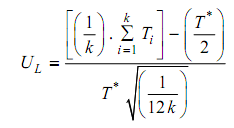
Hence the test statistic
Equation

approximates a standardized normal Variate, the approximation being adequate at the 5%, level of significance for m = 4. [In Eq. (7.1), k = m - 1 and T* = tm if observation stops at the last failure, k = m and T* = the time at which observation stops, otherwise. At a significance level α there is evidence of trend if: UL > Zα/2 (reliability deterioration) UL < - Zα/2 (reliability improvement)].
Compare the calculated 'U' value with normal Variate at 10% level of significance. If calculated value is within - 1.645 to + 1.645, accept the hypothesis, i.e. no trend, else trend exists. [At 5% level of significance the critical values are - 1.96 to + 1.96 and 1% LOS the critical values of Normal Variate are - 2.58 to + 2.58].