Prepare a CPM-type Network Diagram:
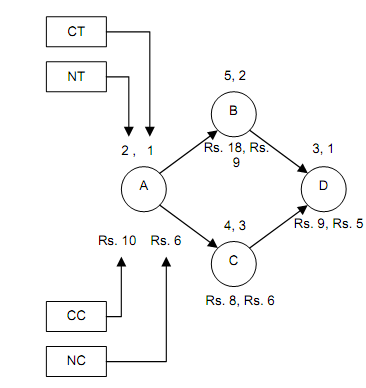
For each activity this diagram should list
Normal Cost (NC)
The lowest expected activity costs. (These are the lesser of the cost figures illustrated under each of node in Figure.)
Normal Time (NT)
The time linked with each normal cost.
Crash Time (CT)
It is the shortest possible activity time.
Crash Cost (CC)
The cost linked with each crash time.

Step 1: CPM Diagram with Activity Cost

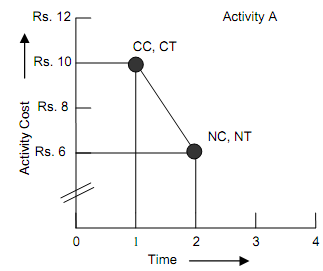
Step 2 : Determination of Cost Per Unit Time

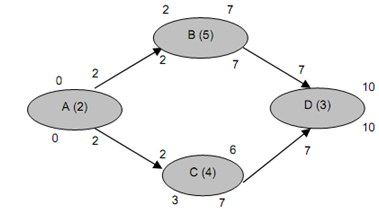
Step 3 : Computation of Critical Path