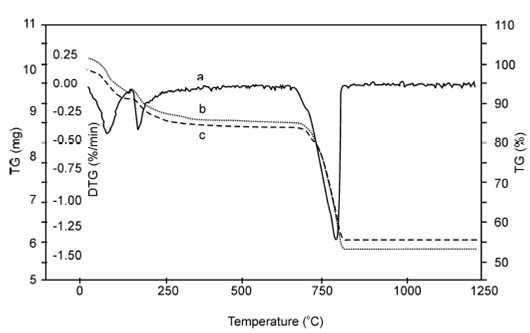
Interpretation of Tg Curves:
TG curves of a pure compound are features of which compound. Using TG curve we could associate the mass changes to the stoichiometry involved. This can frequent lead us directly to the quantitative analysis of samples whose quantitative composition is known. To additional illustrate, let's consider the example of TGA curve of CaCO3, This curve indicates that CaCO3 decomposes in a single step between 800° C and 950° C to form stable oxide CaO and the gas carbon dioxide. This could be explained the chemistry of CaCO3 while it is heated
CaCO3 (s) → CaO (s) + CO 2 (g)
Mr 100.1 56.1 44
Now again consider the Figure, it indicates the % mass lost by the sample is 44 (100.1-56.1) among 800 and 950° C. This exactly corresponds to the mass changes calculations based on stoichiometry of the decomposition of CaCO3 expressed through the chemical Eq. (10.1). As in this case, percentage weight loss of CaCO3 will be
 ... (10.2)
= 44 ×100/100.1 = 44

Figure: TG and DTG Curve of CaCO3 at various heating rates (b =10 oC, c = 3 oC) (DTG = Rate of Change of mass, dm/dt) curve