Characteristics of Mass Spectrum:
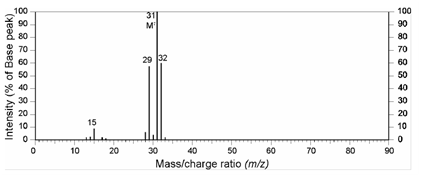
The mass spectrum of methanol (molar mass = 32 gmol-1) is shown as a typical mass spectrum in Figure.

Figure: Mass spectrum of methanol (CH3OH)
The x-axis in the spectrum represents the m/z value of the fragment ions and the y-axis gives the relative intensity or abundance of different fragments. For y-axis the intensity of the peak representing the most abundant fragment (CH2OH+; m/z =31, in this spectrum) is arbitrarily assigned an intensity of 100% and the peak intensities of other ions are measured relative to it. This most intense peak is called as the 'base peak' and it need not necessarily be the molecular ion peak which is at m/z = 32. Are you wondering, why do we observe a small peak at m/ z 33? What is the origin of this peak?