Characteristics of IR Spectrum:
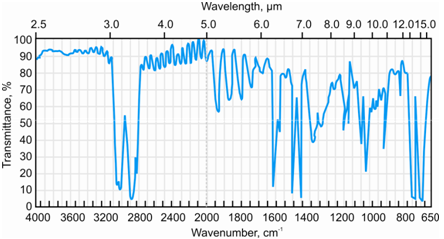
We are sure that on the basis of the discussion above you would have created some picture of the IR spectrum in your mind and must be anxious to know how the IR spectrum actually looks like. A classical IR spectrum is given in Figure.
As you can see the ordinate (Y-axis) represents percent transmittance while the abscissa (X-axis) is either wavenumber or wavelength. It means in which is the positions of IR absorption signals are presented as either wavenumbers (ν) or wavelengths (λ). The wavenumber unit (in cm-1, reciprocal centimeter or centimeter inverse) thus is preferred over wavelength (in µm, micrometers), since an increase in it corresponds to an increase in energy (and frequency) while the wavelength is associated inversely to the energy. Also, by abscissa is marked in cm-1 it is generally (though incorrectly) referred to as the frequency. The frequency by itself is commonly not used because of its inconvenient size. You have to also take note of the change in the scale of abscissa at 2000 cm-1; it is more compact at higher values.

Figure: A representative IR spectrum
You have learnt on UV-VIS spectrometry in which the transmittance, here T, is the ratio of radiant power transmitted by the sample (P) to the radiant power incident on the sample (P0). It ranges from 0 to 100% T.
Having learnt about the origin and the features of IR spectrum let us now learn about the elements of the instruments used for recording the IR spectrum.