Torsional Shear Strength
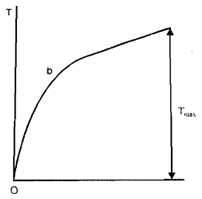
Another significant test performed on steel and C1 is torsion test. In such test one end of specimen is rigidly held whilst twisting moment or torque is applied at the other end. The result of test is plotted as a curve in between torque (T) and angle of twist or angular displacement q. The test terminates at fracture. The T- q curves of a ductile material is extremely much similar to load extension or s-e curve of tensile test except that the torque does not decrease after attaining a maximum value however fracture occurs at maximum torque. It is due to the fact that there is no reduction in the sectional area of the specimen during the plastic deformation. The elastic limit in such case can be found like the point whereas straight line terminates and strain hardening begins, marked as point b in diagram. Mild steel will imply a marked yielding while other ductile materials display smooth transition from elastic to plastic deformation. The plastic deformation zone in torsion is much larger than in tension because the plastic deformation beginning from outer surface spreads inside whiles in tension the stress being uniform over the X-section the plastic deformation spreads over entire section at the similar time.

Diagram of Torque-twist Diagram in Torsion
The modulus of rapture or final torsional shear strength is calculated form as
tu = (¾) (Tmax/J)(d/2)
Where Tmax is maximum torque, j is polar moment of inertia of the specimen section of diameter d. From the T -q diagram the slope of linear region can be found like proportional to modulus of rigidity that is ratio of shearing stress to shearing strain.