Stress Strain Diagram For Mild Steel
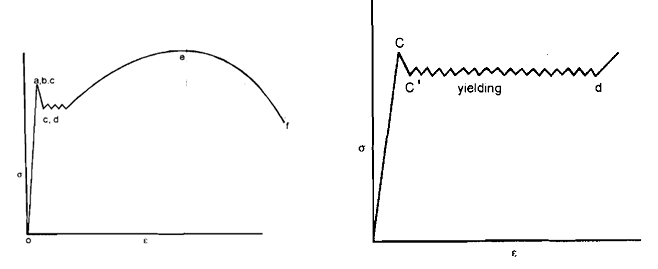
Mild steel as steel classification is no more a popular term. This was in earlier days that group of steel utilized structural purposes was called mild steel. Its carbon content is low and a larger group of steel, named low carbon steel is now utilized for the similar purposes.. Mild steel was perhaps developed first out of all steels and it was manufactured from Bessemer process by blowing out carbon from iron in a Bessemer converter. This was made from pig iron. The interesting point to note that such steel was first studied through s-e diagram and most properties were studied along with respect to this material. The term yield strength or YS is frequently utilized whereas yield behaviors are not detectable in most steel varieties used today. This is mild steel, which very clearly indicates yield behaviour and upper and lower, yield points. Given diagram shows a typical s-e diagram for mild steel.

σ-ε Diagram for Mild Steel
The proportional limit, elastic limit and upper yield point almost coincide. d is lower yield point and deformation from c to d is at mostly constant stress level. There is perceptible drop in stress from c to c'. The deformation from c' to d is almost 10 times the deformation, and so on. This can be seen effectively if strain is plotted on larger scale, as demonstrated on right hand side in above diagram, in which the e scale has been doubled.
The mechanism of yielding is well understood and it is attributed to line defects, is locations. The readers are previously exposed to this defect in the subject of Material Science. This defect in materials is responsible also for effect of strain rate on mechanical properties like UTS, YS and percent elongation. The UTS normally increases along with increasing strain rate and decreases along with increasing temperature. Similar trend is shown by yield strength, especially in low carbon steel.