Ductile Material Stress-Strain Curve:
The graphic results, or stress-strain diagram, of a classical tension test for structural steel is display in Figure. The ratio of stress to strain, or the gradient of the stress-strain graph, is known as the Modulus of Elasticity or Elastic Modulus. A slope of the portion of the curve where stress is proportional to strain (among Points 1 and 2) is referred to as Young's Modulus and Hooke's Law applies.
The subsequent observations are described in Figure:
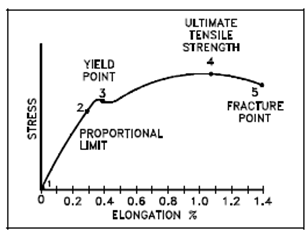
Figure: Typical Ductile Material Stress-Strain Curve
1. Hooke's Law applies among Points 1 and 2.
2. Hooke's Law becomes questionable among Points 2 and 3 and strain rise more rapidly.
3. The area among Points 1 and 2 is known as the elastic region. The material will return to its original length if stress is removed.
4. Point 2 is the PL (proportional limit) or elastic limit, and Point 3 is the YS (yield strength) or yield point.
5. The area among Points 2 and 5 is known as the plastic region since the material will not return to its original length.
6. Point 4 is the point of ultimate strength and Point 5 is the fracture point at that failure of the material occurs.