Stress-Strain Diagrams for Engineering Materials
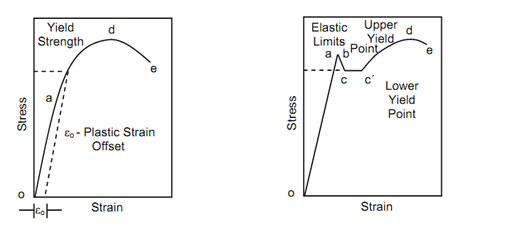
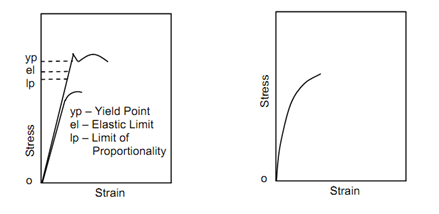
Figure illustrate typical stress-strain diagrams for common engineering materials. Diagram for ductile materials are depicted in Figure, while Figure shows the same for brittle materials. These two sets have the same strain scale and it can be seen that a ductile materials shows considerable deformation before it fails while a brittle material illustrated little deformation. To distinguish between these two types of material, materials with strain less than 5% at fracture are regarded as brittle and those having strains greater than 5% at fracture are called ductile.
The type A ductile materials include steels, aluminium alloys, copper alloys etc., while type B ductile materials are mild steel and structural steels. The difference between type A and type B ductile materials must be noted carefully. In both cases the stress and strain vary linearly upto strain a. This region of deformation is elastic in the sense that if load is removed at any point before reaching point a, the specimen will regain its original length and area of cross-section. Beyond point a, ductile material of type A changes the relationship which is more linear. During this deformation, the strain changes at a faster rate than stress, although this rate tends to decrease. Type B of ductile material shows distinctly different between behaviour than that shown in Figure. From a slightly higher point b (Figure the stress drops suddenly to point c, remains approximately constant over a range, and then follows a pattern similar to that of type A.

(a) Type A (b) Type B
Figure: Stress-strain Diagram for Ductile Materials
The sudden drop in stress from b to c, increase in strain from c to c′ while stress remains approximately constant is known as "yielding". The point b from which the stress drops to point c, is known as "upper yield point" while point c is known as "lower yield point". The deformation at about constant stress is termed as yield deformation.
Once a ductile material has exceeded the elastic deformation it enters into plastic deformation range. During this deformation, the stress reaches maximum value at d, where necking in the specimen begins.
The stress at point d (the engineering stress) is termed as "Ultimate Tensile Strength" which is an extremely significant property. If loading is continued, the specimen fails eventually at e and stress reduces from point d to e. the stress at point e is called "fracture stress".

(a) Type A (b) Type B
Figure: Stress-strain Diagram for Brittle Materials
The deformation between point d and e in Figure is plastic in the sense that if the specimen is unloaded at any point between d and e the specimen will not regain its original size. Figure shows the range of elastic and plastic deformations. The unloading of a specimen from any point f between a & d is known in Figure. Unloading follows a curve which is somewhat parallel to original elastic line. When specimen is fully unloaded to point g, some strain still remains in it. This residual strain is the plastic component of strain by δp, a part of strain between f and g has been recovered and this is elastic part of strain at point f and denoted by εe. Thus, strain at point f,
= ε fp + ε fe