Time Temperature Transformations
The iron-carbon system's phase diagram evokes more interest for engineers to employ the information for useful causes of increasing strength and eliminating locked in stresses via or ignoring retaining an exact phase. Though, important aspect of this a diagram to maintain in mentality is that this presents equilibrium cooling. That type of equilibrium cooling is neither acquired in practice nor is it conducive to enhance desired structure and strength in particular steel. Rising cooling rates shrinks the transformation temperature as liked highlighted and might result information of meta-stable phase. As an illustration, very high cooling rate of iron-carbon system in steel range reasons enhancement of a meta-stable phase known as martensite. This phase doesn't appear in figure of Iron-Carbon Phase Diagram. The steel and cast iron usually carry several alloying elements, within varying amounts. These alloying elements comprise great deal of influence upon precipitation of all the phases and it is not shown by phase diagram also of figure of Iron-Carbon Phase Diagram.
The meta-stable phase marteniste has been introduced now and other phases similar to cementite, and pearlite ferrite were mentioned earlier. Additionally about their structure and properties will be discussed here but before such transformation curves are explained.
Experimental resolve of isothermal transformation curves goes as beneath. A number of samples of the size of a 50 paise coin are austenised merely above the temperature of 723oC as eutectoid temperature. The samples are fast cooled in a salt bath preserved at a temperature slightly below 723oC. After permitting several time intervals the specimens are taken out one through one from the salt both and quenched into water at room temperature.
The consequence microstructure is after that, examined at room temperature. The experiment is repeated along with isothermal transformation of eutectoid steel as both areas of hypo- and hypereutectoid steel at progressively falling temperatures. If transformation temperature is plotted like function of transformation time the resulting curve as represented schematically in following figure is called as isothermal transformation or IT curve, or temperature-time-transformation curve or TTT. It is known also as Bain curve after the metallurgist who one introduced the concept of S curve since of its shape.
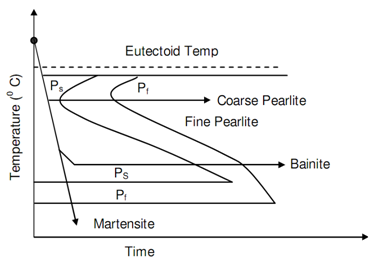
Figure: Time Temperature Transformation Diagram for Plain Carbon Steel
The line marked Ps represents the transformation beginning of austenite in pearlite and the line Pf shows the completion of that transformation. Following figures of TTT Diagrams for 0.8% Carbon Steel along with 0.76 Mn and TTT Diagrams for 0.3% Carbon Hypo-eutectoid Steel represent the TTT diagrams respectively for 0.8% Carbon steel and 0.3% steel. The difference between the two can be noticed. Even the fastest cooling rate will not be capable to mess the nose of the S curve and thus in structure of steel, 100% martensite will not be retained at room temperature. The significant feature of temperature-time-transformation curve is its bending backwards at nose. Underneath the nose the austenite transforms into Bainite. Whenever it is bainite or pearlite, at a temperature known as Ms the transformation in a transition phase Martenstite takes place.
Both martensite and binite may be kept in steel via controlling the rate of cooling. Austenite transforms into bainite, if cooling is adequately fast hence nose is ignored. Whether the part is now held at such temperature for sufficiently long time the bainite is stabilized. Different in, pearlite, in bainite the cementite is within particle form, distributed consistently in the matrix of ferrite. Bainite is tougher, stronger and harder than pearlite. Bainitic steel is extra ductile than pearlitic steel for several level of hardness.
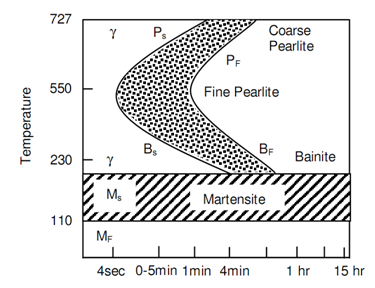
Figure: TTT Diagrams for 0.8% C Steel along with 0.76 Mn
Whether heated steel is cooled sufficiently fast the nose of Ms Temperature, martensite is formed. Its transformation is done at temperature Mf. Martensite has Carbon dissolved in Fe whereby its bcc structure modifies into body centered tetragonal or bct structure and is marked with high hardness due to:
a) Iron lattice's distortion,
b) Very suitable size of martensite plates, and
c) High density of dislocations related along with twining.
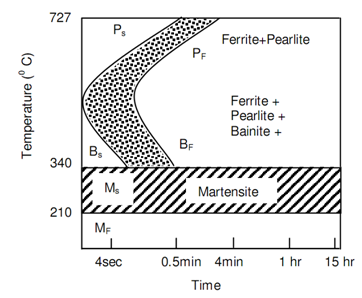
Figure: TTT Diagrams for 0.3% C Hypo-eutectoid Steel
Figure of TTT Curves for Steel and Different Cooling Rates, schematically represents the cooling pattern to generate various phases in steel. Heat treatments specified to steel will be governed via the cooling rates generating final phases along with martensite, bainite or pearlite. A lot of refinements are probable along with cooling control rate and soaking time.
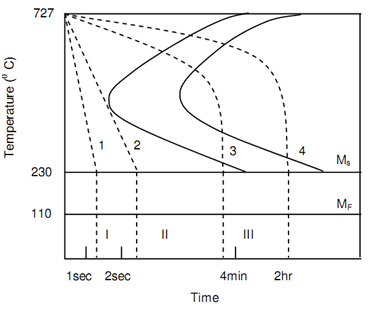
Figure: TTT Curves for Steel and Different Cooling Rates
At such condition, before taking up various methods of heat treatments in some detail, this will be worthwhile to initial describe characteristics and formation of several phases.