Normal Distribution:
The concept of a normal distribution curve is used frequently in statistics. In essence, a normal distribution curve results while a large number of random variables are observed in nature, and their values are plotted. Although this "distribution" of values may take a variety of shapes, it is interesting to note that a extremely large number of occurrences observed in nature possess a frequency distribution which is approximately bell-shaped, or in the form of a normal distribution, as denoted in Figure.
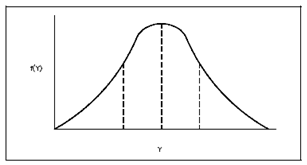
Figure: Graph of a Normal Probability Distribution
The importance of a normal distribution existing in a series of measurements is twofold. First, it elaborates why such measurements tend to possess a normal distribution; and second, it gives a valid primary for statistical inference. Several estimators and decision makers which are used to make inferences about large numbers of data are really sums or averages of those measurements. While these measurements are taken, especially if a large number of them exist, confidence can be obtained in the values, if these values form a bell-shaped curve while plotted on a distribution basis.