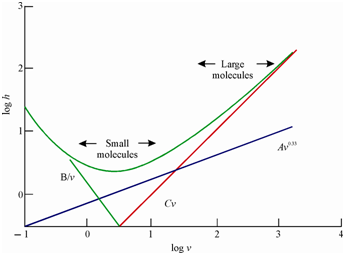
Logarithmic plot of reduced plate:
It may be observed from Figure that a term dominates all along whereas B term arising from axial and longitudinal diffusion, dominates at law decreased velocities. This region of h/v curve is usually avoided. At high velocities, therefore, C term responsible for rises in decrease plate height, dominates. As elaborates earlier, C term contains the contributions from mass transfer kinetics and stagnant pockets of mobile phase. You can see that Eq. 8.4 representing the reduced plate height is independent of particle diameter of the column packing. The constants A, B and C are dependent on the packing of column. The number of plates in a reasonable time may be optimized while operating the

Figure: Logarithmic plot of reduced plate height, h against reduced velocity, ν with a set of values of constants, A = 1, B = 2 and C = 0.1
column at the minimum in the h/v plot of Figure. A column length and particle size of the tm and N are chosen under the experimental conditions of eluent viscosity as illustrated by the following example.
Assuming desired plate counts, N = 5000, reduced plate height, h = 5 and a column length, L = 250 mm, required plate diameter, dp, might be computed using Eq. (8.1).
dp = L/N.h = 250/5000 × 5 = 1/100 mm = 10 µm
Same, while using viscosity parameter (η) and specific column resistance (?) for a fully porous packing, pressure drop (?P) may be calculated using the expression.
?P = φη LvDM/ dp3 = N 2 h2φη/tM
A combination of column lengths and particle sizes including operating pressures for different plate counts and retention times are available in literature.