Demand Curve/Graph:
When the demand schedule is graphed, we obtain a demand curve of Amala. Hence, the demand curve is a graph (or a locus of points) showing the various quantities that will be bought at given prices of a commodity for a given time period, when all other demand factors remain unchanged. A typical demand curve has a negative slope. That is, it slopes downward from left to right depicting the law of demand.
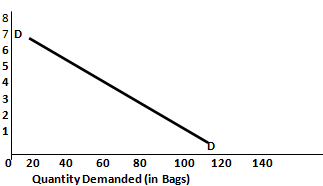
Figure: The Demand Curve of Amala
In figure the demand curve is plotted with ‘price’ on the vertical axis and ‘quantity demand’ on the horizontal axis. In Figure 1, the demand curve (DD) is obtained when we plot from the demand schedule in Table 1.
|
Price
(N000)
|
Quantity Demanded
(bags)
|
|
1
2
3
4
5
6
7
|
120
100
80
60
40
20
0
|