Resolution:
The foregoing discussion on reducing the broadening of the peaks is essentially aimed to achieve a minimum of overlap between the consecutive peaks of the analytes. In other words, the position of elution bands on the horizontal axis and their widths will determine the extent of separation. A quantitative measure of ability of a column to separate two analytes is expressed in terms of a factor resolution (R).

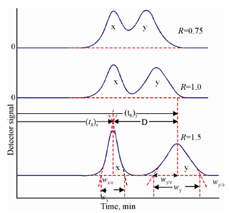
Figure: Separation at three resolutions R= 0.75, 1.0 and 1.5
Above figure shows the chromatogram of two species X and Y on three columns having different resolutions.
R =?D/(WX/2 +WY/2) = 2? D/(WX +WY) = 2[(t R )Y- (t R ) X ] /(WX +WY)
R = 2[(t R ) Y - (t R ) X ]/(1.669(WX / 2 + WY / 2 ))
It is clear from the figure that if R = 1.5, the solutes are virtually completely separated. There will be only 0.3% overlap of two elution bands. In the case of R = 1, the overlap is about 2% and the separation is considered adequate. As R decreases below 1, the overlap starts getting more severe say, at about R = 0.75, there is about 50% overlap and the separation is rated unsatisfactory for most of the purposes.