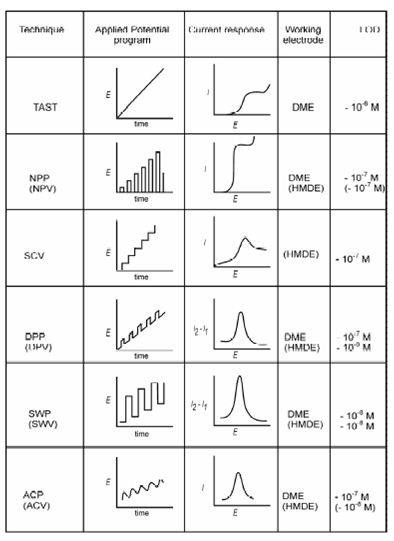
Differential Pulse Polarography (DPP):
A still greater improvement is reached by using the programming wave form as shown in Figure. In this technique a 50 mv pulse is applied during the last 50 ms of the life time of the mercury drop. A current is measured double during the life time of each drop, firstly just before the pulse and second one just before the drop falls. The difference in the current is plotted result a peak shaped curve. The top of the peak corresponds to E½ and the height of the peak depends on the concentration.
The peak current in differential pulse voltammetry increases linearly with the concentration of the analyte. It also rises along with the pulse amplitude but in a complicated linear fashion. Within practice amplitudes greater than 100 mv are not used, since the peaks broaden and the resolution is significantly inhibited.

Figure: Some basic parameters in different voltammetric/polarographic techniques