Saturation Line:
The saturation line shows the states of saturated air at different temperatures. As an instance of fixing such a state on the chart, refer an atmosphere A at 20 oC and saturation as illustrated in Figure. From the steam tables at 20 oC, water vapours pressure
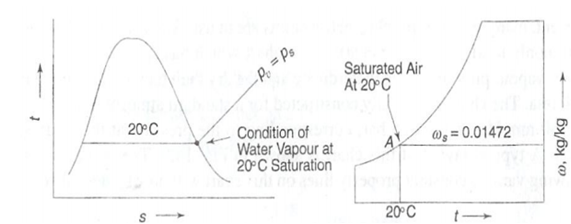
(a) T-s diagram of water (b) Psychrometric Chart
Saturated Air at 20 oC
ps= pv = 17.54 mm Hg =2342 N/m2
Partial pressure of dry air
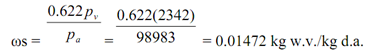
pa=p - pv =101325-2342 = 98983 N/m2
Specific humidity at 20 oC saturation
Knowing t & ω, point a may be plotted. Similarly, saturation states at other temperatures might also be plotted to sketch the saturation line on the psychrometric chart.