Temperature-Entropy (T-s) Diagram
The T-s diagram is the kind of diagram most often used to examine energy transfer system cycles. This is since the work completed by or on the system and the heat further added to or eliminated from the system can be imagined on the T-s diagram. By the definition of entropy, the heat transferred to or from system equivalents the region under the T-s curve of the process. The figure below is the T-s diagram for pure water. The T-s diagram can be built for any pure substance. It displays similar features as P-υ diagrams.
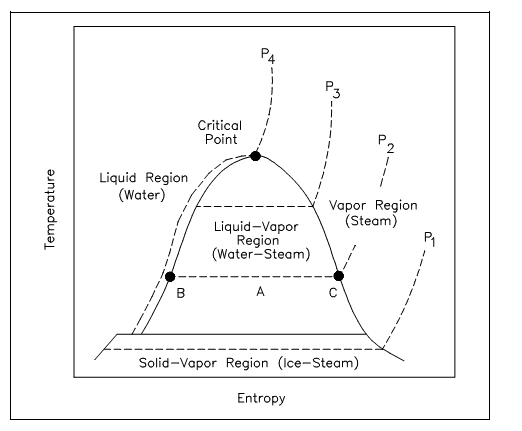
Figure: T-s Diagram for Water
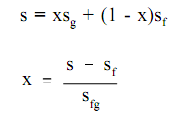
In the liquid-vapor area in the figure above, water and steam exist altogether. For illustration, at point A, water with entropy (sf) specified by point B, exists altogether with steam with an entropy (sg) given by point C. The quality of the mix at any point in the liquid-vapor area can be found by using the relationship shown below.
Here:
s = specific entropy of the mixture (Btu/lbm-°R)
x = quality of the mixture (no units)
sg = specific entropy of the saturated vapor (Btu/lbm-°R)
sf = specific entropy of the saturated liquid (Btu/lbm-°R)
sfg = specific entropy change of vaporization (Btu/lbm-°R) or sfg =sg -sf