Pressure-Specific Volume (P-ν) Diagram
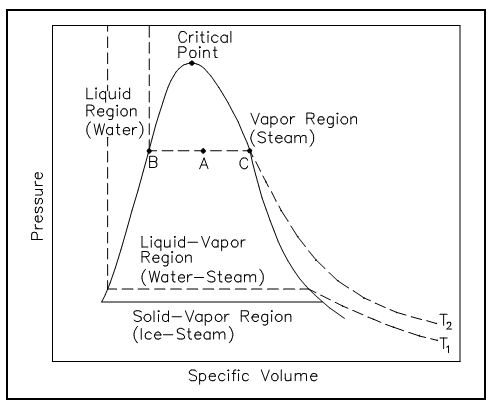
The P-ν diagram is another general kind of property diagram. Figure below is the P-ν diagram for pure water. The P-ν diagram can be built for any pure substance. A P-ν diagram is dissimilar from a P-T diagram in one specifically significant way. There are areas on a P-ν diagram in which two phases exist altogether. In the liquid-vapor area in the figure shown below, water and steam exist altogether.

Figure: P-v Diagram for Water
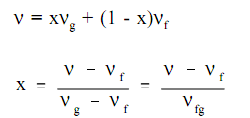
For illustration, at point A, water with a specific volume (νf), given by point B, exists altogether with steam with a specific volume (νg), specified by point C. The dotted lines on figure below are lines of constant temperature. The quality of the mix at any point in the liquid-vapor area can be found since the specific volumes of steam, water, and the mixture are all known. The quality can be found by using the relationship shown below.

Here:
ν = specific volume of the mixture (ft3/lbm)
x = quality of the mixture
νg = specific volume of the vapor (ft3/lbm)
νf = specific volume of the liquid (ft3/lbm)
νfg = specific volume change of vaporization (ft3/lbm) or vfg =vg -vf