Pressure-Enthalpy (P-h) Diagram
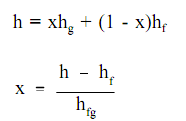
The P-h diagram displays similar features as a P-ν diagram. The figure below is the P-h diagram for pure water. The P-h diagram can be built for any pure substance. Similar to the P-ν diagram, there are areas on a P-h diagram in which two phases exist altogether. In the liquid-vapor area in figure below, water and steam exist altogether. For illustration, at point A, water with an enthalpy (hf), provided by point B, exists altogether with steam with an enthalpy (hg), given by point C. The quality of the mixture at any point in the liquid-vapor area can be found by using the relationship shown below.
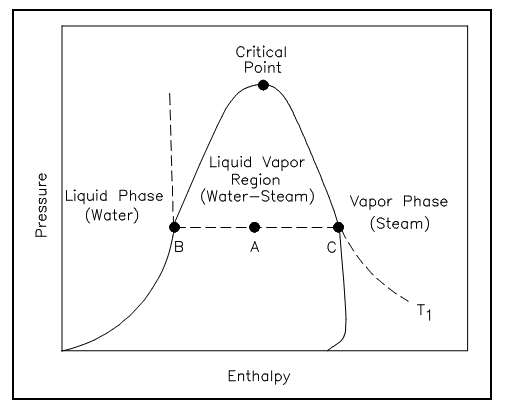
Figure: P-h diagram for Water
Here:
h = specific enthalpy of the mixture (Btu/lbm)
x = quality of the mixture
hg = specific enthalpy of the saturated vapor (Btu/lbm)
hf = specific enthalpy of the saturated liquid (Btu/lbm)
hfg = specific enthalpy change of vaporization (Btu/lbm) or hfg =hg -hf