Psychrometric Chart:
All data necessary for the total thermodynamic and psychrometric analysis of air-conditioning procedure can be summarised in a psychrometric chart. Currently, several forms of psychrometric charts are in use. The chart that is most commonly utilized is the ω-t chart that is a chart which contains water vapour or specific humidity pressure along the dry bulb and the ordinate temperature along the abscissa. Normally the chart is built for a standard atmospheric pressure of 760 mm Hg or 1.01325 bars, correspondent to the pressure on the mean sea level. A typical layout of this chart is illustrated in fig.
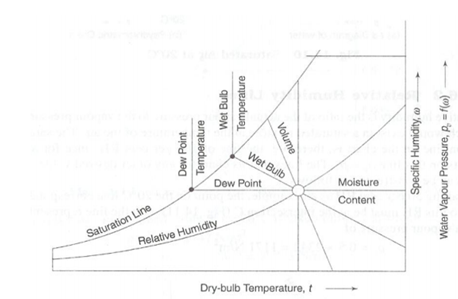
Constant Property Lines on a Psychrometric Chart