Timeline Charts
When creating a software project schedule the planner starts with a group of tasks the work breakdown the Skelton. If automated tools are used the work breakdown is input as a task network or task outline. With the Effort duration and begin date are then input for each stages. In addition tasks may be assigned to specific individuals.
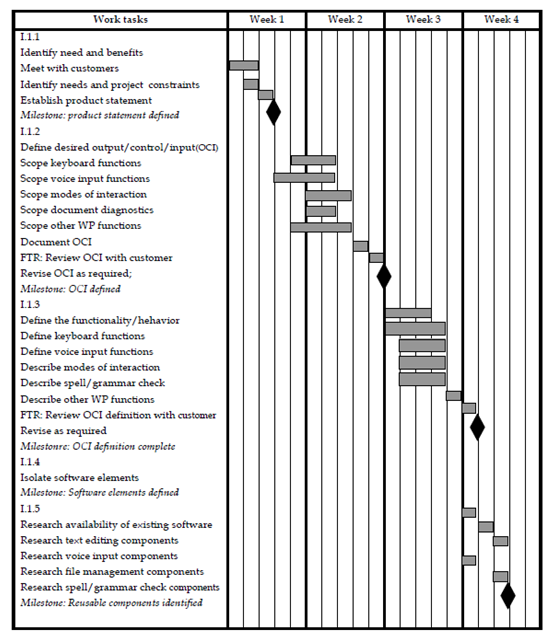
Figure - An example timeline chart
By the consequence of this input a timeline chart which also called a Gantt chart is generated. A timeline chart can be established for the entire project. In other mean, separate charts can be established for every project function or for every individual working on the project.
By the figure, it describes the format of a timeline chart. It depicts a category of a software project schedule which emphasizes the concept scoping task for a new work-processing product of software. All project tasks for concept scoping are described in the left hand column. The horizontal bars in the diagram indicate during of every task. When multiple bars occur at the similar time on the calendar task concurrency is implied. At the end the diamonds indicate milestones.
Once the information of software necessary for the generation of a timeline chart has been input the majority of software project scheduling tools produce project tables a tabular listing of all project tasks by their end dates and actual start and planned and a variety of related information. By used in conjunction with the timeline chart project tables enable the project manager to track progress.