Crossover Charts:
While alternate processes are compared on a single chart, the chart thus produced is called crossover chart. Crossover chart therefore refers to the chart formed by plotting alternate processes on a single chart. It aids in the comparison of many processes. It is depicted in Figure. Break even analysis identifies the processes with lowest total cost for the expected volume and thus helps in process selection. Break even point also mentioned the region of highest profit. In Figure, procedure A has lowest cost below the volume V1, process B has lowest cost for volumes between volumes V1 and V2, and the lowest cost for the procedure C is for volumes above V2.
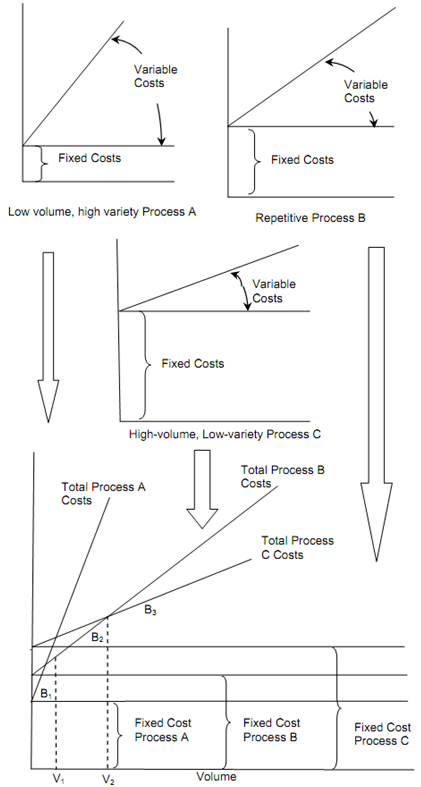
Figure: Crossover Charts