Production Graphs:
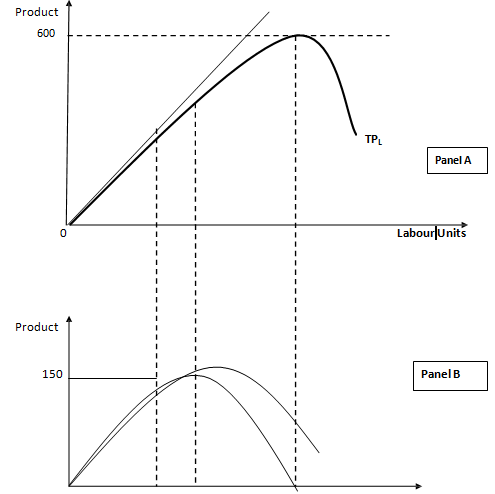
In Figure 1 panels A and B are sketched from Table 1, the Short-run Production Schedule. The figure shows the relationship between MPL, APL and TPL. The MP curve cuts the AP curve at the maximum of the AP curve. The AP curve rises as long as the MP curve is above it. At the highest point of the MP curve the TP curve starts to experience diminishing returns to variable proportions. At the maximum of the TP, MP is equal to zero (i.e the MP curve intersects with the horizontal axis). When AP begins to decline the MP curve is below the AP curve. AP rises and falls, but never reaches zero (0)