Break-Even Chart
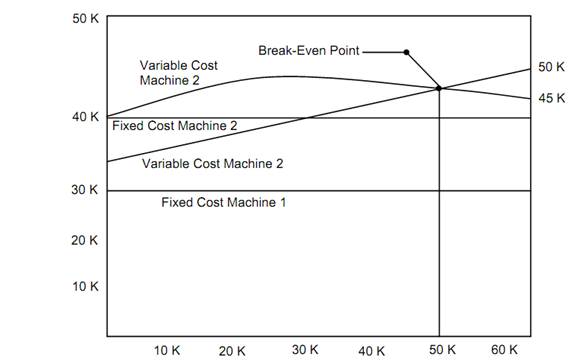
It is the popular tool to compare the two sets of data of any two machines, methods and materials, etc. Here, we are comparing the two machine cost and production quantities. As shown in the Figure 3, first we draw the fixed costs line for the two machines and then on top of these the variable cost lines will be drawn. The two variable costs lines will intersect at one point, that is known as break-even point, where the production quantities are equal for the two machines.
Let us understand more clearly, the cost of the Machine 1 is $ 30,000 and the cost per piece is $ 80. The cost for Machine 2 is $ 40,000 and the cost of per piece is $ 20. In the break even chart it indicates that
Machine 1 is more economical for total production quantities of 45,000 part or less. The chart also indicates that the Machine 2 is economical for total production quantities in excess of 45,000.
No. of Units in 1000s
Figure 3 : The Break-Even Chart