Graphical Notataion part 2
In several software applications a module may be needed to evaluate a complex combination of conditions and select appropriate actions based on these conditions. The Decision tables give a notation which translates conditions and actions into a tabular form. The table is hard to misinterpret and may even be used as a machine readable input to a table driven algorithm.

All old software tools and methods mesh well with new tools and methods of software engineering. The Decision tables are a fine example Decision table’s preceded software engineering through nearly a decade but fit so well with software engineering which they might have been designed for which purpose.
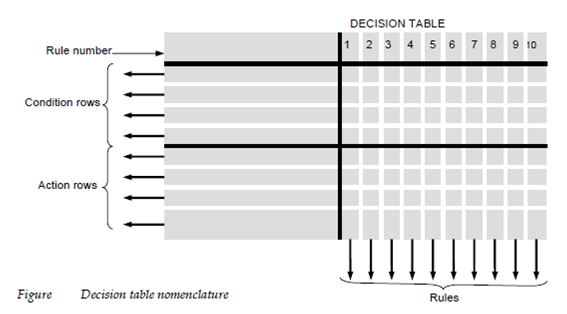
Decision Table Company is described in Figure . The table is separate into 4 sections. The lower left hand quadrant contains a list of all actions that are possible based on combinations of conditions The upper left hand quadrant contains a list of all conditions. The right hand quadrants form a matrix which indicates conditions, combinations, the corresponding actions which will occur for an exact combination. Thus each column of the matrix may be interpreted as a processing rule.
The several steps are applied to establish a decision table:
1. List all actions which can be related with a specific procedure or module.
2. List all decisions or conditions made during execution of the procedure.
3. Relation specific group conditions with elimination impossible combinations of conditions; specific actions, otherwise establish every possible permutation of conditions.
4. Describe rules through indicating what action or actions occur for a group of conditions.
To describe the use of a decision table lets take the following excerpt from a processing narrative for a public utility billing system:

If the customer account is billed using a fixed rate technique a minimum monthly charge is assessed for consumption of less than 100 kWh. Or else computer billing applies a Schedule a rate structure. Moreover if the account is billed using a variable rate technique, a Schedule a rate structure will apply to consumption under 100 kWh with additional consumption billed according to Schedule B.
In the Figure describe a decision table representation of the preceding narrative. Each and every of the 5 rules indicates 1 of 5 viable conditions example for a T true in both fixed rate and variable rate account makes no sense in the circumstance of this procedure As a common rule the decision table can be efficiently used to supplement other procedural design notation.