The Student's-t Distribution
W.S. Gosset presented the t-distribution. The interesting story is that Gosset was employed in a brewery in Ireland. The rules of the company did not permit any employee to publish any research finding independently. So, Gosset adopted the pen-name 'student' and published his findings about this distribution anonymously. Since then, the distribution has come to be known
as the student's-t distribution or simply, the t distribution.
If z1, is a standard normal variant, i.e., z - N(0,1) and z2 is another independent variable that follows the chi-square distribution with k degrees of freedom, i.e  then the variable
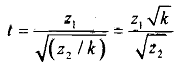
is said to follow student's-t distribution with k degrees of freedom.
The probability curves for the student's-t distribution for different degrees of freedom are presented in Fig.
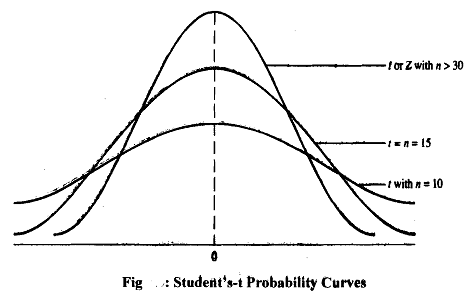
We note the important characteristics of this distribution.
1) As we can see in Fig., like the normal distribution, the student's-t distribution is also symmetric and its range of variation is also from -∞ to + ∞; however, it is flatter than the normal distribution. We should note that as the degrees of freedom increase, the student's-t distribution approaches the normal distribution.
2) The mean of the student's-t distribution is zero, and its variance is k / (k - 2) , where, k is the degrees of freedom.
Like the normal distribution, the student's-t distribution is often used in statistical inferences, particularly when the sample size is small. The task involves the integration of its density function; which may prove to be tedious. As a result, in this case also, like the normal chi-distribution, a table has been constructed for ready-reference purposes.