Calibration curve:
The graph is drawn among the logarithm of the intensity of atomic fluorescence signal versus the logarithm of analyte concentration. As you could see, the linear relationship among the concentration and the fluorescence intensity extends over 3 to 5 sequences of magnitudes.
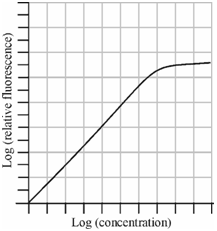
Figure: Typical calibration curve for atomic fluorescence spectrometric determination
Thus, it is valid only at the low concentration of the element. At higher concentration, while fluorescence emission is high, part of emitted light will be absorbed through the atoms within ground state. This is known as self absorption. It will lower the intensity of the emitted radiation and the proportionality is lost. In addition, an efficiency of the fluorescence emission ( φ ) is lowered if the atoms in the excited states lose their energy through a radiationless path e.g, through collisions along with other atoms, whereas the energy of excited state is transferred to the vibrational stages of these atoms. You know which such a mechanism of deactivation of an excited state is known as quenching. The proportion of deactivation through quenching mechanism could be decreased through surrounding the atomisation flames through a noble gas like argon or by using nonflame methods to convert the sample within atoms.
The atomic fluorescence spectrometric method offers benefits over the atomic absorption method as the fluorescence radiation, within principle, is measured against a zero background.