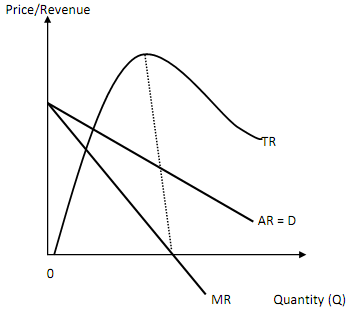
Demand and Revenue Curves for a Price-taking Firm:
The TR curve for a price-taking firm is "n" shaped as shown in Figure 6.6. Both MR and AR (D) curves are downward-sloping straight lines. Both MR and AR curves start from the same point but as quantity sold increases, MR curve lies below the AR or demand curve. TR revenue increases within regions that demand is elastic (MR is positive), TR is constant within regions that demand is unit elastic (MR is zero) and TR decreases within regions that demand is inelastic (MR is negative).

Figure Demand and Revenue Curves for a Price-taking Firm