Rate of change:
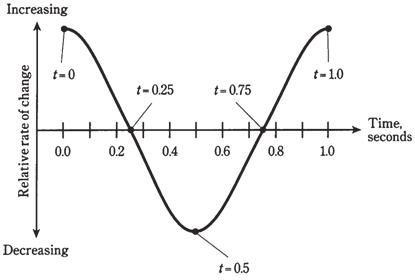
By examining the figure given to us, we can see that there are times the voltage is increasing, and times when it is decreasing. Increasing, in this context, means getting more positive, and decreasing means getting more negative. The most rapid increase in the voltage occurs when t = 0.0 and t = 1.0 in the figure given below. The most rapid decrease takes place when t = 0.5.
When t = 0.25, and when t = 0.75, the instantaneous voltage does not change. This condition exists for a vanishingly small moment. You might liken the value of the voltage at t = 0.25 to altitude of a ball you have tossed straight up into the air, when it reaches the highest point of it. Likewise, the value of voltage at t = 0.75 is akin to position of a swing at the lowest altitude.
If n is whole number, then situation at t = n.25 is the similar to as it is for t = 0.25, for t = n.75, things are the same as they are when t = 0.75. The single cycle shown in the Figure given below represents every possible condition of the alternating current sine wave having a frequency of 1 Hz and a peak value of plus or minus 1 V.
Assume that you graph the rate of change in voltage of wave in the Figure given below against time. It turns out that it will have a shape which is a sine wave, but it will be displaced to left of the original wave by one quarter of the cycle. If you plot the relative rate of change against time the as shown in the Figure given below, you get the derivative, or the rate of change, of sine wave. This is a cosine wave, having the similar general, characteristic shape as sine wave. But the phase of it is different.

Figure--A sine wave representing the rate of change in instantaneous amplitude of the wave.