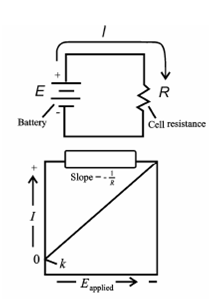
Plot of current vs. potential:
The given equation could be rearranged to give
I = - Eapplied/R + 1/ R + (Ecathode - Eanode)
I = Ecell - Eapplied/R
For small currents and brief periods of time, Ecathode and Eanode remain associatively constant during electrolysis. The cell behavior could be represented through the reaction.
I = (- Eapplied/ R) + k
where, k is a constant.

Figure: A plot of current vs. potential
As shown in Figure, a plot of current as a function of applied potential within an electrolytic cell should be a straight line along with a slope equivalent to the negative reciprocal of the resistance. The plot is indeed linear within small currents as in Figure. Since the applied voltage rise, the current deviates significantly from linearity. Galvanic cells also behave in a same way.