Stackelberg Model:
In Stackelberg model, quantity is the strategic variable of the firms. We would analyse the model in terms of iso-profit curves. Let us assume that there are two profit maximising duopolistic firms A and B. An iso-profit curve shows the alternative combinations of output qA (quantity of output of firm A) and qB (quantity of output of firm B) that would yield the same profit. Let us suppose the following
- Demand function faced by both the firms are p = p (q), where q = qA+qB ,the aggregate output produced by both the firms.
- Cost function Ci = Ci (qi) where i = A,B
Derivation of Iso-profit Curve:
Consider the profit function of firm A given by,
ΔA = pqA - C(qA) and
take Δ0 to be the desired level of profit. To arrive at the iso-profit curve of firm A choose those combinations of qA and qB, which would yield a profit level of Δ0 to it;
i.e., Δ0 = pqA - C(qA) = p(q) qA - C(qA) = p(qA+qB) qA - C(qA)
To arrive at those combinations of qA and qB, we totally differentiate Δ0, to get
dΔ0 = pdqA + qA dp - ∂C/∂qA dqA
or, 0 = pdqA + qA dp/dq(dqA + dqB ) - ∂C/∂qA dqA
As Δ0 is a constant, dΔ0 = 0 and pdqA + qA dp/dq (dqA + dqB) - ∂C/∂qA dqA =0.
By simple manipulation, we see that
dqB/dqA = - [(MRA + MCA)/(qA dp/dq)]. The demand curve by assumption is downward sloping, therefore dp/dq < 0. Hence, the iso-profit curve will be > = < 0 according as MRA> = < MCA.
Diagrammatically the iso-proft curve will have an inverted U shape as shown in Figure.
qA remaining constant at q Aif qB increases from q B to q B , the firm ends up at the iso-profit curve Δ0, which represents a lower level of iso-profit than Δ1. Hence, the iso-profit curves lying away from the horizontal axis represents lower level of profit. The objective of firm A being profit maximisation, it would try to produce such an output that is on the highest iso-profit curve, for a given level of output of firm B. Given say output level q1B firm A would obtain maximum
profit by producing q2A amount of output which is given by the tangency between q1B and the innermost iso-profit curve. Therefore, locus of the highest points of the iso-profit curves of firm A gives the reaction function of firm A. By a similar process, we can derive the iso-profit curve of firm B. The reaction function of a firm gives it's best response to any output decision of it's rival.
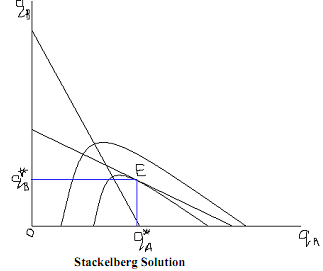
The Stackelberg model of oligopoly deals with the leadership of a firm. Let firm A be the leader which implies that it will make a conjecture that firm B will accept A's output as a datum while making a output plan and B will actually behave in this manner. In other words, firm A will incorporate this in the profit maximising objective of firm B. For this reason, which the conjectural variation of firm B is zero, it is non-zero for firm A. Basically, firm B operates on the naïve Cournot conjecture. In other words, firm A being the leader can perceive the reaction function of firm B and would know before hand the strategy firm B is going to adopt. Firm A incorporates this knowledge in its profit maximising exercise in the sense that it knows the reaction function of B. Given the iso-profit curves of A and the reaction function of B, firm A can find out from the tangency between the two. This is illustrated in the following diagram. In the diagram, point E gives the Stackelberg equilibrium. Firm B being on its reaction function would have no incentive to deviate from E. In addition, as firm A is maximising its profit, it has no incentive to deviate. Hence, this equilibrium is stable.