Retention Time:
In the preceding sub-section, we have introduced a term known as retention time. It is time taken after sample injection for the analyte peak to reach the detector. It is denoted by the symbol tR and in Figure is represented.
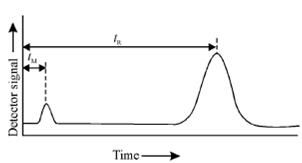
Figure: Small peak at the left represents a species that is not retained and reaches the detector immediately. tM is approximately equal to the time needed for the molecules of the mobile phase to pass through the column
The small peak in the beginning on the left is for the species that is not retained at the column. Sometimes, the sample may contain an unretained species. If it is there it may be added because it helps in peak identification. The time tM for the unretained species is the same as the average rate of migration of mobile phase molecules. If L is the length of the column, an average rate of migration of solute molecules is given through the following expression:
v = L / t R
Similarly, the average linear rate of migration of mobile phase molecule
u = L/ t M
where, tM is called dead time. It is the time required for the average molecules of the mobile phase to pass through the column. After getting familiar with the terms distribution constant and retention time, it may be important to look into the relationship among the two terms. Here we express migration rate of a solute
v = u × fraction of time solute spends in the mobile phase