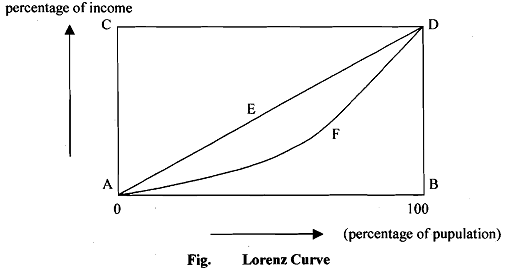
Lorenz Curve:
Lorenz curve is used to study the distribution of personal incomes of a set of population. The level of the inequality in the distribution of income levels can be measured by drawing a Lorenz curve. This method was developed by Max 0. Lorenz in 1905 for showing the distribution of income amongst people. The Lorenz curve is a graph based on the cumulative distribution of income and shows the proportion of the distribution of income amongst households. The percentage of households is plotted on the x-axis, the percentage of income on the y-axis. Thus Lorenz curve is a function of the cumulative proportion of ordered individuals mapped onto the corresponding cumulative proportion of their income. The Lorenz curve can also be used to show distribution of assets like land to indicate the prevailing social inequality. If all individuals are of the same size, the Lorenz curve is a straight diagonal line (the line AED in Fig.1. This line is called the line of equality. If there is any inequality in size, then the Lorenz curve falls below the line of equality. The total amount of inequality can be judged by the area AEDF; the larger the area, greater is the inequality.
