Analysis of mass spectrum:
To demonstrate the analysis of a mass spectrum, we shall look at the simple alkane nonane shown in figure. Nonane encompass a molecular formula of C9H20 and a molecular weight of 128. The parent ion is the molecular ion at 128.
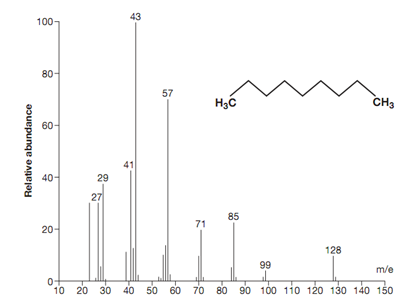
Figure: Mass spectrum for nonane.
There is a small peak at m/e 129 that is due to a molecule of nonane consisting of one 13C isotope (i.e.12C8 13CH20). The natural abundance of 13C is 1.1%. Hence the chances of a 13C isotope being exist in nonane are 9 × 1.1% = 9.9%.
The base peak is at m/e 43. This is most probably a propyl ion [C3H7] +. There are peaks at m/e 29, 43, 57, 71, 85 and 99. These types of peaks are all 14 mass units apart that correspond to a CH2 group. The existence of a straight chain alkane is frequently pointed out by peaks that are 14 mass units apart.