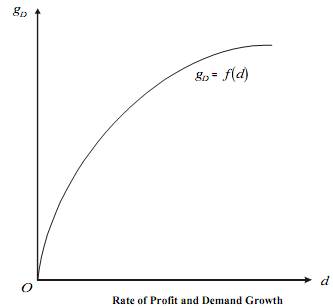
Growth Rate of Demand (gD):
gD = f1 (d, k)
where d = diversification rate i.e., the number of new products introduced per time period.
k = the proportion of successful new products.
Note that k depends on d, P, A, R&D, intrinsic value of the products. Marris combines intrinsic value with price. In addition, as price is assumed to have reached equilibrium in some way or other, price is taken as given. Thus, k comes to depend on d, A and R&D. The higher A and/or R&D, higher is k. Marris also uses 'm' as a proxy for A and R&D. Because m is negatively related to A and R&D, it is negatively correlated to k.
Finally, we have,


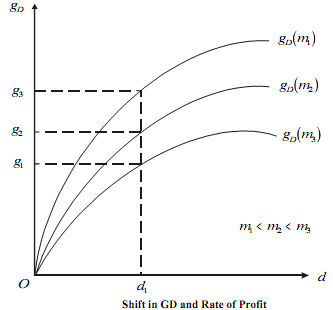
The average rate of profit (m) is constant along any D g curve. Therefore, we have a curve like that in Figure. As m increases, gD decreases, so the curves shift down as shown in Figure, for a given d. This is because, for a given d, (say d1), lower the m, higher is A and R&D. Therefore, higher is k and hence higher is the growth rate.