TTT Plots
It is a plot of line segments joined between two successive discrete points. These points of scaled TTT and unreliability (CDF) are obtained from the failure data. It gives a picture of failure data in a plot of unit square. If the plot is concave (convex) above (below) the diagonal line, increasing (decreasing) failure rate can be inferred. When curve embraces diagonal line a constant failure rate can be assumed. Let t1, t2. . . tn be the n failure times of an equipment with suspensions between two few successive failure times. If all the units are put into test at the same time, then the total test time TTTi for all units at time ti is defined as,
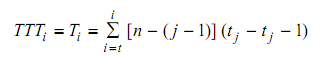
which is equivalent to the cumulative time up to the end of ti for, i = 1,2, . . . , n where
t0=0. This is shown pictorially in following Figure The plot of CDF (which is equal to i/n) versus normalised TTT value (TTTi/ TTTn) is the TTT plot.
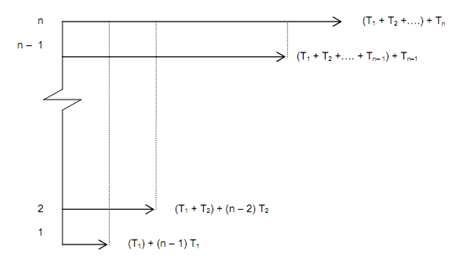
Figure: Total Time on Test Calculation
When the sample size 'n' increases to infinity the TTT plot converges to a life distribution F (t) from which the sample has come and it is the TTT transform. If tn is not the last observed failure, then a pseudo time or last censored time after last failure, tn + 1 is defined as,
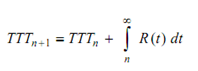
and the scaled TTT is, φi = TTTi /TTT n +1