Method of Total Time on Test (TTT) Plotting
The technique of TTT plotting originally suggested by Barlow and Campo (1975) is very simple to use for machine failure data analysis. Like other probability methods, this method is also based on assumption that the Time Between Failures (TBF) are independently and identically distributed (IID) so that the actual chronological ordering of the TBFs can be ignored. Thus it is not useful in analyzing a data set which have structures and are positive to serial correlation tests.
The Theory of TTT Plotting
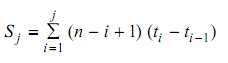
Suppose that 0 = t0 < t1 < t2 . . . < tn is ordered sample of times to failure of a unit, then the TTT is given by
Thus S0 = 0;
S1 = n t1;
S2 = n. t1 + (n - 1) (t2 - t1) = S1 + (n - 1) (t2 - t1)
S3 = S2 + (n - 2) (t3 - t2) and
Si = n. t1 + (n -1) (t2 - t1) + . . . + (n - i +1) (ti - ti -1) denote the sum or total time on test (TTT) at Ti, i = 1, 2, 3, 4 . . . n.
The TTT plot is obtained by plotting (i/n, ui) for i = 0, 1, 2, 3 . . . n, where ui = Si /Sn on a unit square and connecting the plotted points by the line segments. If the plot is concave downwards, the machine is deteriorating and if the plot is concave upwards then the machine is improving (note that it is opposite characteristic in Trend Plot) and if the plot wriggles around the diagonal many times, the machine is experiencing constant failure rate.