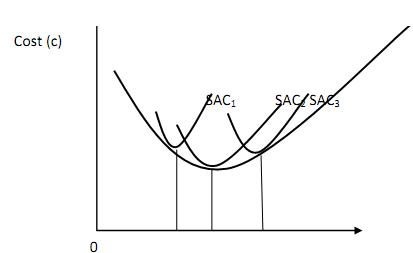
Long-Run Average Cost Curve:
In the short-run an entrepreneur may operate with SAC1, SAC2 and SAC3 guided by the growth of his firm or output. In the long-run , however, the producer has to build a plant whose size leads to the lease average cost for any level of output. As a planning device the producer regards the heavily shaded portions of the SACs curves in figure 6.4 as his long - run average cost curve. This section of the SACs curve indicates the least unit cost of producing output levels. This curve is graphed in figure below as a smooth U- shaped curve.

When the long-run average cost (LAC) curve is drawn for a firm with an infinite number of plant sizes we obtain the conventional "U" shaped LAC curve in Figure above. The LAC curve is frequently referred to as an envelope curve of the SAC curves, because it is derived from the least cost points of the various SACs curves. The LAC is so regarded because each SAC represents various short run period of the firm.