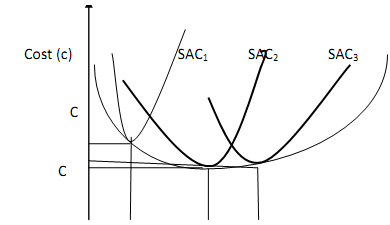
Derivation of the Long-Run Average Cost Curve (LAC):
The relationship between the Long-run Average Cost Curve (LAC) and the short-run Average Cost curve (SAC) can be used to derive the conventional "U" shaped LAC curve. Suppose technology is such that plants in a certain industry can assume only three different sizes. That is, the fixed capital equipment making up the plant is available only in three sizes - small, medium and large. Suppose again that the small size plant gives rise to SAC1,the medium one yields SAC2, and the large plant results in SAC3 as illustrated in Figure .

An entrepreneur in the long run has to choose among the three alternative plant sizes. If the entrepreneur expects his most profitable output to be Q1, he will select the small size plant (i.e. SAC1) if on the other hand, he perceives Q2 as the most profitable level of output, then the medium size plant will be chosen (i.e. SAC2).These choices are made on consideration that the entrepreneur aims at producing the desired level of output at a lowest per unit cost. If the entrepreneur expects his production to be at either Q1 or Q2 his decision will be more difficult. At each of these positions, two plants with different SACs could be engaged. Suppose that with time he actually finds it desirable to increase his output from Q1 to Q2. He can do this with his plant (SAC1) at an average cost of OC1 per unit. In the short-run this is all that he can do but he can plan for the future. Once his old plant has worn out, he can replace it with a new plant, and in our hypothetical example, his choice will be the medium size plant SAC2. This is because cost per unit of producing Q2 is very high on SAC1 (OC1) as compared with cost per unit of producing Q2 on SAC2 (OC2) which is substantially less.