Plotting the Learning Curves:
As indicated earlier, there may be various ways to plot and therefore to understand the learning curves. Initially, the explanation of exponential curve as an arithmetic procedure is given as follows.
In this approach, the column of units are attained by doubling the rows, i.e. 1, 2, 4, 8, 16, 32, etc. and their corresponding cost or time is attained by multiplying with the learning curves. In case of 85% learning, the time (cost) of utilized second unit shall become 85% of the first unit. Following figure illustrated the typical learning curve for the 75%, 85%, and 95% learning .
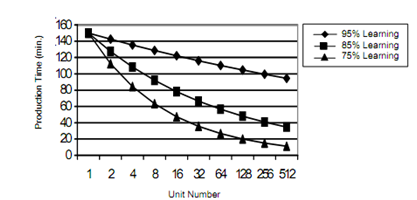
Figure: Arithmetic Plot of 75%, 85% and 95% Learning Curve
In case of logarithmic plot, unit curves are linear throughout the range, while cumulative curves made linear up to some point only.