TG Curves of polymers:
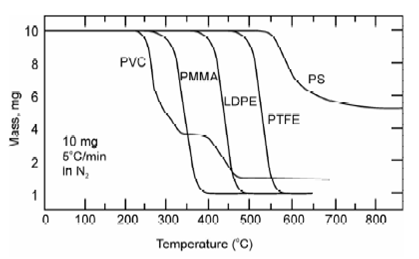
We have look above how TG Curves is associated to stoichiometry (quantitative interpretation). Now we see in following example how it could be used to compare thermal stability of materials (qualitative interpretation). Such information could be used to select material for certain end-use application, predict product performance and improve product quality. Figure gives TG Curves of some polymers. TG Curves clearly denotes that polymer (PVC) is the least thermally stable and polymer (PS) is most thermally stable. Polymer (PS) looses no weight at all below about 500º C and then decomposes abruptly through about 600ºC. The other three polymers have all decomposed through about 450ºC. Polymers (PMMA) decompose more slowly whole than the others as denoted through slopes of TG curves. TG curve of polymer (PMMA) has fewer slopes than the others.

Figure: TG Curves of some polymers: PVC = polyvinyl chloride; PMMMA = polymethyl methacrylate, LDPE = low density poly ethylene; PTFF = ploytetra fluoroethylene; and PS = polystyrene.