Interpolation and Extrapolation:
Developing a curve from a set of data gives the student with the opportunity to interpolate among given data points. Using the curve in the subsequent example, the value of the dependent variable at 4.5 can be estimated through interpolating on the curve among the two data points given, resulting in the value of 32. Remember that the interpolation is the procedure of acquiring a value on the plotted graph that lies among two given data points. Extrapolation is the process in that information is gained from plotted data through extending the data curve beyond the points of given data (using the basic shape of the curve as a guide), and then estimating the value of a provided point through using the extended (extrapolated) curve as the source. The above principles are described in the example that follows.
Example:
Given equation y = x2 + 2x + 3:
Plot the curve for x from 0 to 5.
Extrapolate the curve & give the value of y at x = 6.
Put 6 into the equation evaluating y after that compare the values.
Interpolate the curve at x = 4.5.
Put 4.5 into the equation evaluating y after that compare the values.
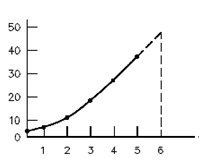
Extrapolating x = 6 gives a value of y = 48.
Using the equation, the actual value of y is 51.
Interpolating x = 4.5 gives a value of y = 32.
Using the equation, the actual value of y is 32.25.