Graphical Understanding of Integral:
As with derivatives, while a functional relationship is presented in graphical form, an important understanding of the meaning of integral could be developed.
Figure is a plot of the instantaneous velocity, v, of an object since a function of elapsed time, t. The functional relationship display is given by the following equation:
v = 6t
The distance traveled, s, among times tA and tB equals the integral of the velocity, v, with respect to time between the limits tA and tB.

The value of this integral can be determined for the case plotted in Figure through noting that the velocity is increasing linearly. Therefore, the average velocity for the time interval among tA and tB is the arithmetic average of the velocity at tA and the velocity at tB. At time tA, v = 6tA; at time tB, v = 6tB. Therefore, the average velocity for the time interval among tA and tB is 6tA +6tB/2 that equals 3(tA + tB). Using this average velocity, the total distance traveled in the time interval between tA and tB is the product of the elapsed time tB - tA and the average velocity 3(tA + tB).
s = v avΔt
s = 3(tA+ tB)(tB - tA)
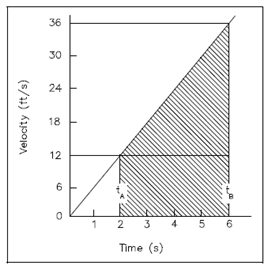
Figure: Graph of Velocity vs. Time