Representation of NMR:
The NMR spectrum is recorded on a chart paper with X-axis representing chemical shift (δ) in ppm and Y-axis as intensity. A δ values rise from right to left. The value of zero on the X axis corresponds to the internal standard, tetramethylsilane (TMS) signal. Since you have learnt previously, the low δ values correspond to high field and vice versa. The NMR spectra are normally recorded in two modes; absorption and integral modes. The output consists of two traces one is the spectrum i.e., the absorption signals at different δ values and the other called integration trace.
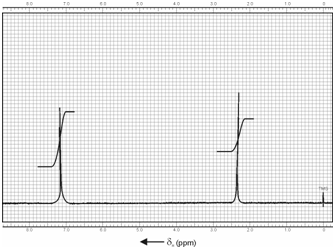
Figure: A sample NMR spectrum showing the absorption and the integration traces
The integral trace gives the area under different peaks and appears as step function superimposed on the NMR spectrum as typically illustrated in Figure. The integral tracing is usually recorded from left to right. The height that the tracing rises for each group of protons is proportional to the area enclosed through the peak, and therefore to the number of protons responsible for that absorption.
In general, however, NMR spectra can be classified into two broad groups; low resolution or broad / wide line and high resolution or sharp line spectrum. In a wide line spectrum, band width of the lines is large enough and the fine structure due to chemical environment causing spin-spin splitting is obscured. Such spectra are obtained from low field NMR spectrometers usually of < 100 MHz and are useful for the study of physical environment of the absorbing species.