Pictorial method of lag:
It is not necessary to construct an entire RL plane to find the phase angles. You can use a ruler which has centimeter and millimeter markings, and a protractor.
At first, draw a line more than 10 cm long, going from left to right on the sheet of paper. Use ruler and a sharp pencil. Then, by the help of the protractor, construct a line off the left end of this 1st line, going vertically upwards. Make this line 10 cm long.
The horizontal line, or the one going to right, is the R axis of the crude coordinate system. The vertical line is the XL axis.
If you are knowing the values of XL and R, divide them down, or multiply them up so that they are both between 0 and 100. For instance, if XL=680 Ω and R= 840
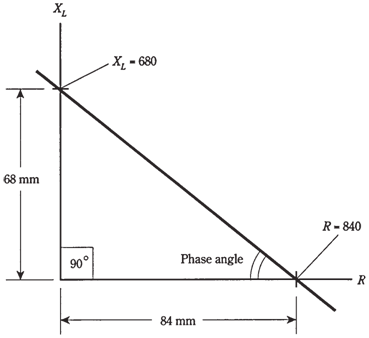
Ω, you can divide them both by 10 to get XL= 68 and R=84. Plot these points lightly by making hash marks on vertical and horizontal lines you have drawn. The R mark will be 84 mm to right of the origin, or intersection of the original 2 perpendicular lines. The XL mark will be 68 mm up from origin.
Draw the line connecting the 2 hash marks, as shown in the Figure given below. This line will run at the slant, and will form a triangle along with the 2 axes. Your hash marks, and origin of coordinate system, form vertices of the right triangle. The triangle is called as right because one of the angles of it is a right angle (90 °.)

Figure-- Pictorial method of finding phase angle.
Measure the angle between slanted line and horizontal, or R, axis. Extend one or both of lines if necessary in order to get the good reading on protractor. This angle will be between 0 and 90 °, and represents the phase angle in RL circuit.
The actual vector, R = jXL , is found by constructing a rectangle by using the origin and your 2 hash marks as 3 of the 4 vertices, and drawing new horizontal and vertical lines to complete the figure. The vector is diagonal of this rectangle, as shown in the Figure given below. The phase angle is angle between this vector and the R axis. It will be same as the angle of slanted line in the Figure given below.