Logarithmic Graphs:
Often, the function to be plotted on a graph makes it convenient to use scales various from those used for the Cartesian coordinate graphs. Logarithmic graphs in that one or both of the scales are divided logarithmically are general. A semi-log plot is used while the function is an exponential, such as radioactive decay. A semi-log plot is acquired by using an ordinary linear scale for one axis and a logarithmic scale for the other axis. A log-log plot is used while the function is a power. A log-log plot is acquired by using logarithmic scales for both axes. Below table gives data on the amount of radioactive strontium 90 present as a function of time in years. Each twenty-five years one-half of the material decays. Figure below with table is a Cartesian coordinate graph of the data given in Table. It can be seen from Figure in which it is difficult to determine from this plot the amount of strontium 90 present after long periods of time such as 125 years, 150 years, or 175 years.
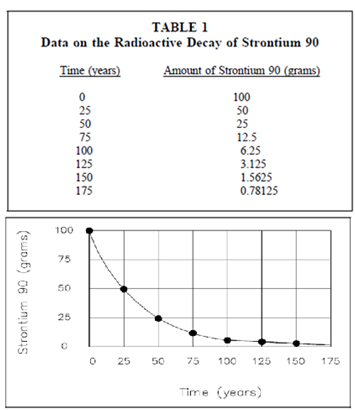
Figure: Cartesian coordinate Plot of Radioactive Decay of Strontium 90
If the similar data, the decay of strontium 90, is plotted on semi-log, the output plot will be a straight line. This is since the decay of radioactive material is an exponential function. The output straight line of the semi-log plot permits a more accurate extrapolation or interpolation of the data than the curve acquired from the cartesian plot. For graphs in that both of the quantities (x,y) vary as a power function, a log-log plot is convenient. A log-log plot is acquired by using logarithmic scales for both axes. Another table gives data on the frequency of electromagnetic radiation as a function of the wavelength of the radiation.