Graphing Equations:
Algebraic equations including two unknowns can readily be display on a graph. Figure shows a plot of the equation x + y = 5. The equation is solved for corresponding sets of values of x and y that satisfy the equation. Every of these points is plotted and the points linked. The graph of x + y = 5 is a straight line.
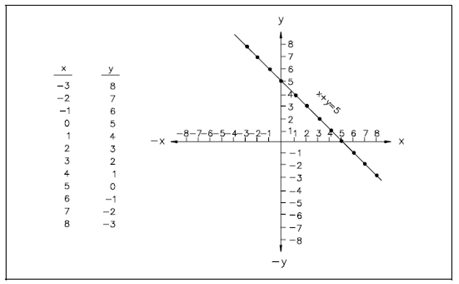
Figure: Plot of x + y = 5
The x-intercept of a line on a graph is described as the value of the x-coordinate while the y-coordinate is zero. It is the value of x where the graph intercepts the x-axis. The y-intercept of a graph is described as the value of the y-coordinate while the x-coordinate is zero. It is the value of y where the graph intercepts the y-axis.